怎么阅读google perf tool产生的profile结果
如何阅读google perf tool产生的profile结果?参考: http://google-perftools.googlecode.com/svn/trunk/do
如何阅读google perf tool产生的profile结果?
参考: http://google-perftools.googlecode.com/svn/trunk/doc/cpuprofile.html
基本方法简述:
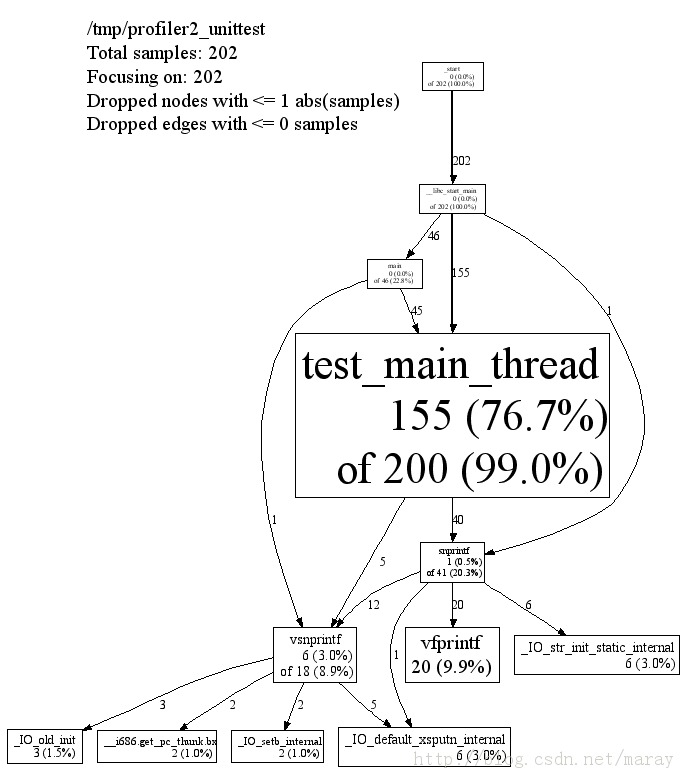
Class NameMethod Namelocal (percentage)of cumulative (percentage)
ts_main_thread, 76.7%表示ts_main_thread这个函数本身消耗的时间片(不包含子程序消耗的时间),99%表示表示ts_main_thread这个函数及其所调用的子函数一起消耗的时间片。寻找热点,首先关注cumulative的percentage,寻找最大的。然后再分析它下面每个函数分别消耗多少时间。
