【D3.V3.js系列教程】--(十)更自由的条形图
1、添加一个矩形
//Width and height var w = 500; var h = 100; var dataset = [ 5, 10, 13, 19, 21, 25, 22, 18, 15, 13, 11, 12, 15, 20, 18, 17, 16, 18, 23, 25 ]; //Create SVG element var svg = d3.select("body") .append("svg") .attr("width", w) .attr("height", h); svg.selectAll("rect") .data(dataset) .enter() .append("rect") .attr("x", 0) .attr("y", 0) .attr("width", 20) .attr("height", 100);
2、添加更多条控制x坐标的起始位置(i*21)
//Width and height var w = 500; var h = 100; var dataset = [ 5, 10, 13, 19, 21, 25, 22, 18, 15, 13, 11, 12, 15, 20, 18, 17, 16, 18, 23, 25 ]; //Create SVG element var svg = d3.select("body") .append("svg") .attr("width", w) .attr("height", h); svg.selectAll("rect") .data(dataset) .enter() .append("rect") .attr("x", function(d, i) { return i * 21; //Bar width of 20 plus 1 for padding }) .attr("y", 0) .attr("width", 20) .attr("height", 100);
3、均匀的添加条-定条宽除的方式(i * (w / dataset.length);)作为条和间隙的总宽度,在设置固定宽度小于总宽度,这时就会自然生成一个空白间隙
一句话:条的宽度固定,总宽-条宽=空白宽。空白宽取决于总宽,总宽取决于计算表达式(w / dataset.length)
//Width and height var w = 500; var h = 100; var barPadding = 1; var dataset = [ 5, 10, 13, 19, 21, 25, 22, 18, 15, 13, 11, 12, 15, 20, 18, 17, 16, 18, 23, 25 ]; //Create SVG element var svg = d3.select("body") .append("svg") .attr("width", w) .attr("height", h); svg.selectAll("rect") .data(dataset) .enter() .append("rect") .attr("x", function(d, i) { return i * (w / dataset.length); }) .attr("y", 0) .attr("width", 20) .attr("height", 100);
4、均匀的添加条-定间隙宽一句话:间隙的宽度固定,总宽-空白宽=条宽。条宽取决于总宽(w / dataset.length - barPadding),总宽取决于计算表达式(w / dataset.length)
//Width and height var w = 500; var h = 100; var barPadding = 1; var dataset = [ 5, 10, 13, 19, 21, 25, 22, 18, 15, 13, 11, 12, 15, 20, 18, 17, 16, 18, 23, 25 ]; //Create SVG element var svg = d3.select("body") .append("svg") .attr("width", w) .attr("height", h); svg.selectAll("rect") .data(dataset) .enter() .append("rect") .attr("x", function(d, i) { return i * (w / dataset.length); }) .attr("y", 0) .attr("width", w / dataset.length - barPadding) .attr("height", 100);
5、条高用条长-纵坐标(纵坐标是从上到下计算,即下方向为正):h - (d * 4);
var w = 500; var h = 100; var barPadding = 1; var dataset = [ 5, 10, 13, 19, 21, 25, 22, 18, 15, 13, 11, 12, 15, 20, 18, 17, 16, 18, 23, 25 ]; //Create SVG element var svg = d3.select("body") .append("svg") .attr("width", w) .attr("height", h); svg.selectAll("rect") .data(dataset) .enter() .append("rect") .attr("x", function(d, i) { return i * (w / dataset.length); }) .attr("y", function(d) { return h - (d * 4); }) .attr("width", w / dataset.length - barPadding) .attr("height", function(d) { return d * 4; });
6、颜色用据数据集生成的动态RGB值填充:
attr("fill", function(d) { return "rgb(0, 0, " + (d * 10) + ")";
//Width and height var w = 500; var h = 100; var barPadding = 1; var dataset = [ 5, 10, 13, 19, 21, 25, 22, 18, 15, 13, 11, 12, 15, 20, 18, 17, 16, 18, 23, 25 ]; //Create SVG element var svg = d3.select("body") .append("svg") .attr("width", w) .attr("height", h); svg.selectAll("rect") .data(dataset) .enter() .append("rect") .attr("x", function(d, i) { return i * (w / dataset.length); }) .attr("y", function(d) { return h - (d * 4); }) .attr("width", w / dataset.length - barPadding) .attr("height", function(d) { return d * 4; }) .attr("fill", function(d) { return "rgb(0, 0, " + (d * 10) + ")"; });
7、文本标记(可是数值)指定XY的坐标
return i * (w / dataset.length) + (w / dataset.length - barPadding) / 2;
return h - (d * 4) + 14;
svg.selectAll("text") .data(dataset) .enter() .append("text") .text(function(d) { return d; }) .attr("text-anchor", "middle") .attr("x", function(d, i) { return i * (w / dataset.length) + (w / dataset.length - barPadding) / 2; }) .attr("y", function(d) { return h - (d * 4) + 14; }) .attr("font-family", "sans-serif") .attr("font-size", "11px") .attr("fill", "white");
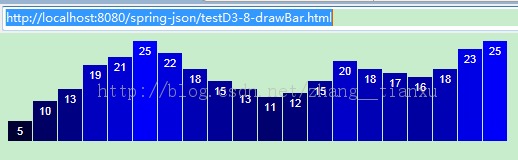
8、源码
<!DOCTYPE html><html> <head><meta charset="utf-8"><title>testD3-8-drawBar.html</title><script type="text/javascript" src="http://localhost:8080/spring/js/d3.v3.js"></script><style type="text/css"></style></head><body><script type="text/javascript">//Width and heightvar w = 500;var h = 100;var barPadding = 1;var dataset = [ 5, 10, 13, 19, 21, 25, 22, 18, 15, 13,11, 12, 15, 20, 18, 17, 16, 18, 23, 25 ];//Create SVG elementvar svg = d3.select("body").append("svg").attr("width", w).attr("height", h);svg.selectAll("rect") .data(dataset) .enter() .append("rect") .attr("x", function(d, i) { return i * (w / dataset.length); }) .attr("y", function(d) { return h - (d * 4); }) .attr("width", w / dataset.length - barPadding) .attr("height", function(d) { return d * 4; }) .attr("fill", function(d) {return "rgb(0, 0, " + (d * 10) + ")"; });svg.selectAll("text") .data(dataset) .enter() .append("text") .text(function(d) { return d; }) .attr("text-anchor", "middle") .attr("x", function(d, i) { return i * (w / dataset.length) + (w / dataset.length - barPadding) / 2; }) .attr("y", function(d) { return h - (d * 4) + 14; }) .attr("font-family", "sans-serif") .attr("font-size", "11px") .attr("fill", "white");</script></body></html>
9、效果