【D3.V3.js系列教程】--(八)绘制SVG【D3.V3.js系列教程】--(八)绘制SVG1、创建SVG//Width and heightvar w 50
【D3.V3.js系列教程】--(八)绘制SVG
【D3.V3.js系列教程】--(八)绘制SVG1、创建SVG
//Width and heightvar w = 500;var h = 50;var svg = d3.select("body") .append("svg") .attr("width", w) // <-- Here .attr("height", h); // <-- and here!2、数据驱动的SVGvar dataset = [ 5, 10, 15, 20, 25 ];var dataset = [ 5, 10, 15, 20, 25 ];
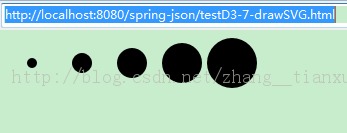
var circles = svg.selectAll("circle") .data(dataset) .enter() .append("circle");circles.attr("cx", function(d, i) { return (i * 50) + 25; }) .attr("cy", h/2) .attr("r", function(d) { return d; });<!DOCTYPE html><html> <head><meta charset="utf-8"><title>testD3-7-drawSVG.html</title><script type="text/javascript" src="http://localhost:8080/spring/js/d3.v3.js"></script><style type="text/css"></style></head><body><script type="text/javascript">//Width and heightvar w = 500;var h = 50;//Datavar dataset = [ 5, 10, 15, 20, 25 ];//Create SVG elementvar svg = d3.select("body").append("svg").attr("width", 500).attr("height", 50);var circles = svg.selectAll("circle") .data(dataset) .enter() .append("circle");circles.attr("cx", function(d, i) {return (i * 50) + 25;}) .attr("cy", h/2) .attr("r", function(d) {return d; });</script></body></html>4、效果