利用JFrameChart生成报表
案例一:利用application生成(解决中文乱码问题)
源代码如下:
package test;import java.awt.Font;import java.io.FileOutputStream;import java.io.IOException;import org.jfree.chart.ChartFactory;import org.jfree.chart.ChartUtilities;import org.jfree.chart.JFreeChart;import org.jfree.chart.axis.CategoryAxis;import org.jfree.chart.axis.NumberAxis;import org.jfree.chart.plot.CategoryPlot;import org.jfree.chart.plot.PlotOrientation;import org.jfree.chart.title.TextTitle;import org.jfree.data.category.CategoryDataset;import org.jfree.data.category.DefaultCategoryDataset;public class Test{public static void main(String[] args) throws IOException{CategoryDataset dataset = getDataSet();JFreeChart chart = ChartFactory.createBarChart3D("水果产量图", // 图表标题"水果", // 目录轴的显示标签"产量", // 数值轴的显示标签dataset, // 数据集PlotOrientation.VERTICAL, // 图表方向:水平、垂直true, // 是否显示图例(对于简单的柱状图必须是false)false, // 是否生成工具false // 是否生成URL链接);FileOutputStream fos_jpg = null;try {fos_jpg = new FileOutputStream("D:\\fruit.jpg");ChartUtilities.writeChartAsJPEG(fos_jpg,1,chart,400,300,null);} finally {try {fos_jpg.close();} catch (Exception e) {}}}/** * 获取一个演示用的简单数据集对象 * @return */private static CategoryDataset getDataSet() {DefaultCategoryDataset dataset = new DefaultCategoryDataset();dataset.addValue(100, "成都", "苹果");dataset.addValue(200, "成都", "梨子");dataset.addValue(300, "成都", "葡萄");dataset.addValue(400, "成都", "香蕉");dataset.addValue(500, "西昌", "苹果");dataset.addValue(200, "西昌", "梨子");dataset.addValue(300, "西昌", "葡萄");dataset.addValue(400, "西昌", "香蕉");return dataset;}/** * 获取一个演示用的组合数据集对象 * @return */private static CategoryDataset getDataSet2() {DefaultCategoryDataset dataset = new DefaultCategoryDataset();dataset.addValue(100, "北京", "苹果");dataset.addValue(100, "上海", "苹果");dataset.addValue(100, "广州", "苹果");dataset.addValue(200, "北京", "梨子");dataset.addValue(200, "上海", "梨子");dataset.addValue(200, "广州", "梨子");dataset.addValue(300, "北京", "葡萄");dataset.addValue(300, "上海", "葡萄");dataset.addValue(300, "广州", "葡萄");dataset.addValue(400, "北京", "香蕉");dataset.addValue(400, "上海", "香蕉");dataset.addValue(400, "广州", "香蕉");dataset.addValue(500, "北京", "荔枝");dataset.addValue(500, "上海", "荔枝");dataset.addValue(500, "广州", "荔枝");return dataset;}}
增加如下的代码,解决汉字乱码问题:
CategoryPlot categoryplot = (CategoryPlot) chart.getPlot();NumberAxis numberaxis = (NumberAxis) categoryplot.getRangeAxis(); CategoryAxis domainAxis = categoryplot.getDomainAxis(); TextTitle textTitle = chart.getTitle(); textTitle.setFont(new Font("黑体", Font.PLAIN, 20)); domainAxis.setTickLabelFont(new Font("sans-serif", Font.PLAIN, 11)); domainAxis.setLabelFont(new Font("宋体", Font.PLAIN, 12)); numberaxis.setTickLabelFont(new Font("sans-serif", Font.PLAIN, 12)); numberaxis.setLabelFont(new Font("黑体", Font.PLAIN, 12)); chart.getLegend().setItemFont(new Font("宋体", Font.PLAIN, 12));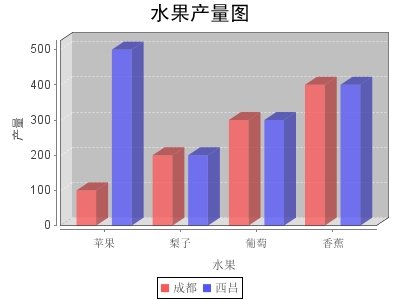
标题乱码
chart.getTitle().setFont(new Font("宋体", Font.BOLD,12));
其他
1. CategoryAxis domainAxis = plot.getDomainAxis(); 2. 3. // NumberAxis valueAxis=(NumberAxis) plot.getRangeAxis(); 4. //有人说这个是水平方向设置的 方法。 5. ValueAxis numberaxis = plot.getRangeAxis(); 6. 7. /*------设置X轴坐标上的文字-----------*/ 8. domainAxis.setTickLabelFont(new Font("sans-serif", Font.PLAIN, 11)); 9. 10. /*------设置X轴的标题文字------------*/ 11. domainAxis.setLabelFont(new Font("宋体", Font.PLAIN, 12)); 12. 13. /*------设置Y轴坐标上的文字-----------*/ 14. numberaxis.setTickLabelFont(new Font("sans-serif", Font.PLAIN, 12)); 15. 16. /*------设置Y轴的标题文字------------*/ 17. numberaxis.setLabelFont(new Font("黑体", Font.PLAIN, 12)); 18. 19. /*------这句代码解决了底部汉字乱码的问题-----------*/ 20. jfreechart.getLegend().setItemFont(new Font("宋体", Font.PLAIN, 12)); 案例二:Struts2+JFreeChart
前言
关于Struts2入门以及提高等在这里就不介绍了,但是关于Struts2的学习有以下推荐:
- struts2-showcase-2.0.6.war:这个是官方自带的Demo(struts-2.0.6-all.zip\struts-2.0.6\apps目录下),非常全面,直接部署就可以了(很多朋友Struts2能学很好我估计还是直接从这里学来的)。wiki-WebWork:入了门的朋友应该都知道,strust2由webwork2和struts1.x合并起来的,但主要还是以webwork2为主,所以如果找不到Struts2的资料可以找WebWork资料看看。Max On Java的博客,他的博客的资料在中文的Struts2算是比较全的了,写得很详细。The Code Project、Google - CodeSearch、Koders:这几个代码搜索网站在我找不到中文资料甚至英文文章的时候帮了我大忙!
关于JFreeChart入门等这里我也不打算介绍了,中文资料很多了。
正题
下面以边帖图片和代码的方式来讲解Struts2与JFreeChart的整合。
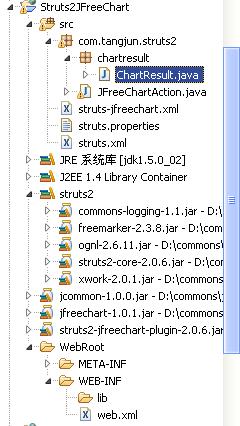
搭建环境:首先帖一张工程的目录结构以及所需的jar包。注意:如果你不打算自己写ChartResult的话只需要引入struts2-jfreechart-plugin-2.0.6.jar(这个在struts-2.0.6-all.zip可以找到了):
1.依次帖web.xml、struts.xml、struts.properties和struts-jfreechart.xml几个配置文件的代码:
web.xml
<web-app version="2.4"
xmlns="http://java.sun.com/xml/ns/j2ee"
xmlns:xsi="http://www.w3.org/2001/XMLSchema-instance"
xsi:schemaLocation="http://java.sun.com/xml/ns/j2ee
http://java.sun.com/xml/ns/j2ee/web-app_2_4.xsd">
<filter>
<filter-name>struts2</filter-name>
<filter-class>
org.apache.struts2.dispatcher.FilterDispatcher
</filter-class>
</filter>
<filter-mapping>
<filter-name>struts2</filter-name>
<url-pattern>/*</url-pattern>
</filter-mapping>
</web-app>
struts.xml
<!DOCTYPE struts PUBLIC
"-//Apache Software Foundation//DTD Struts Configuration 2.0//EN"
"http://struts.apache.org/dtds/struts-2.0.dtd">
<struts>
<include file="struts-jfreechart.xml" />
</struts>
struts.properties
struts-jfreechart.xml
<!DOCTYPE struts PUBLIC"-//Apache Software Foundation//DTD Struts Configuration 2.0//EN"
"http://struts.apache.org/dtds/struts-2.0.dtd">
<struts>
<package name="jFreeChartDemonstration" extends="struts-default"
namespace="/jfreechart">
<result-types>
<result-type name="chart" class="org.apache.struts2.dispatcher.ChartResult"></result-type>
</result-types>
<action name="JFreeChartAction" class="com.tangjun.struts2.JFreeChartAction">
<result type="chart">
<param name="width">400</param>
<param name="height">300</param>
</result>
</action>
</package>
</struts>
说明:这里只需要说明下struts-jfreechart.xml,这里直接调用已经写好的类ChartResult,这个类是继承自com.opensymphony.xwork2.Result,传入生成图片大小的参数width和height就可以了。
2. 新建JFreeChartAction继承ActionSupport,生成JFreeChart对象并保存到chart中,注意这个名称是固定的。
import com.opensymphony.xwork2.ActionSupport;
import org.jfree.chart.ChartFactory;
import org.jfree.chart.JFreeChart;
import org.jfree.data.general.DefaultPieDataset;
public class JFreeChartAction extends ActionSupport {
/**
*
*/
private static final long serialVersionUID = 5752180822913527064L;
//供ChartResult调用->ActionInvocation.getStack().findValue("chart")
private JFreeChart chart;
@Override
public String execute() throws Exception {
//设置数据
DefaultPieDataset data = new DefaultPieDataset();
data.setValue("Java", new Double(43.2));
data.setValue("Visual Basic", new Double(1.0));
data.setValue("C/C++", new Double(17.5));
data.setValue("tangjun", new Double(60.0));
//生成JFreeChart对象
chart = ChartFactory.createPieChart("Pie Chart", data, true,true, false);
return SUCCESS;
}
public JFreeChart getChart() {
return chart;
}
public void setChart(JFreeChart chart) {
this.chart = chart;
}
}
OK!至此代码已经全部贴完。
输入访问 http://localhost:8080/Struts2JFreeChart/jfreechart/JFreeChartAction.action
显示结果如下:
补充
以上生成的图片是PNG格式的图片,如果需要自定义图片格式的话(好像只能支持JPG和PNG格式),那么自己写一个ChartResult继承自StrutsResultSupport,见代码:
package com.tangjun.struts2.chartresult;
import java.io.OutputStream;
import javax.servlet.http.HttpServletResponse;
import org.apache.struts2.ServletActionContext;
import org.apache.struts2.dispatcher.StrutsResultSupport;
import org.jfree.chart.ChartUtilities;
import org.jfree.chart.JFreeChart;
import com.opensymphony.xwork2.ActionInvocation;
public class ChartResult extends StrutsResultSupport {
/**
*
*/
private static final long serialVersionUID = 4199494785336139337L;
//图片宽度
private int width;
//图片高度
private int height;
//图片类型 jpg,png
private String imageType;
@Override
protected void doExecute(String arg0, ActionInvocation invocation) throws Exception {
JFreeChart chart =(JFreeChart) invocation.getStack().findValue("chart");
HttpServletResponse response = ServletActionContext.getResponse();
OutputStream os = response.getOutputStream();
if("jpeg".equalsIgnoreCase(imageType) || "jpg".equalsIgnoreCase(imageType))
ChartUtilities.writeChartAsJPEG(os, chart, width, height);
else if("png".equalsIgnoreCase(imageType))
ChartUtilities.writeChartAsPNG(os, chart, width, height);
else
ChartUtilities.writeChartAsJPEG(os, chart, width, height);
os.flush();
}
public void setHeight(int height) {
this.height = height;
}
public void setWidth(int width) {
this.width = width;
}
public void setImageType(String imageType) {
this.imageType = imageType;
}
}
如此的话还需要小小的修改一下struts-jfreechart.xml:
<!DOCTYPE struts PUBLIC
"-//Apache Software Foundation//DTD Struts Configuration 2.0//EN"
"http://struts.apache.org/dtds/struts-2.0.dtd">
<struts>
<package name="jFreeChartDemonstration" extends="struts-default"
namespace="/jfreechart">
<!-- 自定义返回类型 -->
<result-types>
<!--
<result-type name="chart" class="org.apache.struts2.dispatcher.ChartResult"></result-type>
-->
<result-type name="chart" class="com.tangjun.struts2.chartresult.ChartResult"></result-type>
</result-types>
<action name="JFreeChartAction" class="com.tangjun.struts2.JFreeChartAction">
<!--
<result type="chart">
<param name="width">400</param>
<param name="height">300</param>
</result>
-->
<result type="chart">
<param name="width">400</param>
<param name="height">300</param>
<param name="imageType">jpg</param>
</result>
</action>
</package>
</struts>
OK!显示的效果是一样的,只是图片格式不一样,当然这里面你可以做更多操作!