JVM内存模型测试--Thread
?今天在SUN的jdk上测试了Thread栈占用内存的情况,帮助进一步了解JVM的内存模型。配置如下:
WIN7+4G?
?
SUN JDK:
D:\maven\smart\smart>java -versionjava version "1.6.0_21"Java(TM) SE Runtime Environment (build 1.6.0_21-b06)Java HotSpot(TM) Client VM (build 17.0-b16, mixed mode, sharing)
?
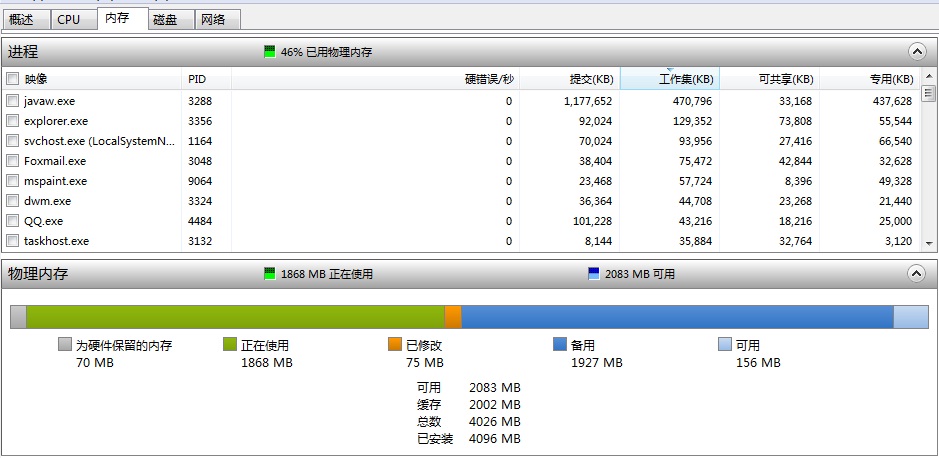
初始内存情况如下:
????
?
?测试类代码如下:
?
package org.smart.threadtest;public class ThreadStackTest extends Thread {public ThreadStackTest(long num) {super("[ThreadStackTest] Thread:" + num);};public void run() {String threadName = Thread.currentThread().getName();// System.out.println(threadName + " start.");try {Thread.sleep(10000);} catch (Exception e) {System.out.println("Exception from " + threadName + ".run");}}public static void main(String[] args) {ThreadStackTest t2 = null;for (int i = 0; i < 10000; i++) {System.out.println("Thread " + i + " start...");t2 = new ThreadStackTest(i);t2.start();}}}?
?
?测试配置为:每个线程分配10240k就是10M的Stack,heap分配1024M,命令行如下:
D:\Java\jdk1.6.0_20\bin\java -Djava.compiler=NONE -verbose:gc -XX:+HeapDumpOnOutOfMemoryError -XX:HeapDumpPath=d:/temp/java.phd -Xms1024m -Xmx1024m -XX:+PrintGCDetails -XX:+PrintHeapAtGC -XX:ThreadStackSize=10240 -cp D:\maven\smart\smart\target\test-classes\ org.smart.threadtest.ThreadStackTest
?
?输出结果:
??
Thread 72 start...Thread 73 start...Thread 74 start...Thread 75 start...Thread 76 start...Exception in thread "main" java.lang.OutOfMemoryError: unable to create new native thread at java.lang.Thread.start0(Native Method) at java.lang.Thread.start(Thread.java:597) at org.smart.threadtest.ThreadStackTest.main(ThreadStackTest.java:22)Heap def new generation total 314560K, used 14417K [0x03b50000, 0x190a0000, 0x190a0000) eden space 279616K, 5% used [0x03b50000, 0x0493ba48, 0x14c60000) from space 34944K, 0% used [0x16e80000, 0x16ea8d18, 0x190a0000) to space 34944K, 0% used [0x14c60000, 0x14c60000, 0x16e80000) tenured generation total 699072K, used 0K [0x190a0000, 0x43b50000, 0x43b50000) the space 699072K, 0% used [0x190a0000, 0x190a0000, 0x190a0200, 0x43b50000) compacting perm gen total 12288K, used 2088K [0x43b50000, 0x44750000, 0x47b50000) the space 12288K, 16% used [0x43b50000, 0x43d5a110, 0x43d5a200, 0x44750000)No shared spaces configured.
?
从输出可以看出,启动了76个线程之后,内存溢出,有两个比较奇怪的地方:
1、没有产生heapdump文件(注:如果是heap内存满可以产生,测试过,配置没有错)
2、在WIN7资源监视器中显示内存基本没有波动,也就是说这些内存只是被jvm标记,没有实际使用,包括heap--我猜
?
76×10M + 1024M = 1784M?大概为 1800M左右,和操作系统空闲差200M
?
修改测试配置,将heap大小调整到124M,命令如下:
?
D:\Java\jdk1.6.0_20\bin\java -Djava.compiler=NONE -verbose:gc -XX:+HeapDumpOnOutOfMemoryError -XX:HeapDumpPath=d:/temp/java.phd -Xms124m -Xmx124m -XX:+PrintGCDetails -XX:+PrintHeapAtGC -XX:ThreadStackSize=10240 -cp D:\maven\smart\smart\target\test-classes\ org.smart.threadtest.ThreadStackTest
?输出结果:
Thread 161 start...Thread 162 start...Thread 163 start...Thread 164 start...Thread 165 start...Thread 166 start...Exception in thread "main" java.lang.OutOfMemoryError: unable to create new native thread at java.lang.Thread.start0(Native Method) at java.lang.Thread.start(Thread.java:597) at org.smart.threadtest.ThreadStackTest.main(ThreadStackTest.java:23)Heap def new generation total 38080K, used 23783K [0x2bee0000, 0x2e830000, 0x2e830000) eden space 33856K, 69% used [0x2bee0000, 0x2d5ef4b8, 0x2dff0000) from space 4224K, 4% used [0x2e410000, 0x2e43a860, 0x2e830000) to space 4224K, 0% used [0x2dff0000, 0x2dff0000, 0x2e410000) tenured generation total 84672K, used 0K [0x2e830000, 0x33ae0000, 0x33ae0000) the space 84672K, 0% used [0x2e830000, 0x2e830000, 0x2e830200, 0x33ae0000) compacting perm gen total 12288K, used 369K [0x33ae0000, 0x346e0000, 0x37ae0000) the space 12288K, 3% used [0x33ae0000, 0x33b3c710, 0x33b3c800, 0x346e0000) ro space 10240K, 54% used [0x37ae0000, 0x3805b760, 0x3805b800, 0x384e0000) rw space 12288K, 55% used [0x384e0000, 0x38b7f798, 0x38b7f800, 0x390e0000)
?
结果显示启动了166个线程。
166×10M + 124M? = 1784M 大概为1800M,结果和上面的对比一下,可以知道TreadStack确实占用的是操作系统内存,和heapsize本身无关。
?
?
IBM JDK:
java version "1.6.0"Java(TM) SE Runtime Environment (build pwi3260sr8fp1ifix-20100924_01(SR8 FP1+IZ81201+IZ80998+IZ83034+IZ83273))IBM J9 VM (build 2.4, JRE 1.6.0 IBM J9 2.4 Windows 7 x86-32 jvmwi3260sr8ifx-20100923_65174 (JIT enabled, AOT enabled)J9VM - 20100923_065174JIT - r9_20100401_15339ifx6GC - 20100308_AA)JCL - 20100728_01
?
测试类还是沿用上面测试SUN JDK的类:ThreadStackTest
设置环境变量:
IBM_HEAPDUMP_OUTOFMEMORY=TRUEIBM_HEAPDUMPDIR=<directory>IBM_JAVACOREDIR=<directory>IBM_JAVADUMP_OUTOFMEMORY=TRUE
?
测试配置也相同:每个线程分配10240k就是10M的Stack,heap分配1024M,命令行如下:
?
D:\Java\ibm_jdk16.0\bin\java -Djava.compiler=NONE -verbose:gc,sizes -Xms1024m -Xmx1024m -Xss10240K -Xiss10240K -cp D:\maven\smart\smart\target\test-classes\ org.smart.threadtest.ThreadStackTest
?
输出如下:
<?xml version="1.0" ?><verbosegc version="20100308_AA"> -Xmca32K RAM 类分段增量 -Xmco128K ROM 类分段增量 -Xmns0K 初始新空间大小 -Xmnx0K 最大新空间大小 -Xms1G 初始内存大小 -Xmos1G 初始旧空间大小 -Xmox1G 最大旧空间大小 -Xmx1G 最大内存 -Xmr16K 已记住的集合大小 -Xmso256K 操作系统线程堆栈大小 -Xiss10M Java 线程堆栈初始大小 -Xssi16K Java 线程堆栈增量 -Xss10M Java 线程堆栈最大大小<initialized> <attribute name="gcPolicy" value="-Xgcpolicy:optthruput" /> <attribute name="maxHeapSize" value="0x40000000" /> <attribute name="initialHeapSize" value="0x40000000" /> <attribute name="compressedRefs" value="false" /> <attribute name="pageSize" value="0x1000" /> <attribute name="requestedPageSize" value="0x1000" /></initialized>Thread 0 start...Thread 1 start...Thread 2 start...............Thread 81 start...Thread 82 start...<sys id="1" timestamp="Jan 26 14:35:08 2011" intervalms="0.000"> <time exclusiveaccessms="0.050" meanexclusiveaccessms="0.050" threads="0" lastthreadtid="0x41F92300" /> <refs soft="6" weak="4" phantom="0" dynamicSoftReferenceThreshold="32" maxSoftReferenceThreshold="32" /> <tenured freebytes="1072352000" totalbytes="1073741824" percent="99" > <soa freebytes="1018665216" totalbytes="1020055040" percent="99" /> <loa freebytes="53686784" totalbytes="53686784" percent="100" /> </tenured> <gc type="global" id="1" totalid="1" intervalms="0.000"> <classunloading classloaders="0" classes="0" timevmquiescems="0.000" timetakenms="0.087" /> <finalization objectsqueued="2" /> <timesms mark="13.684" sweep="4.105" compact="0.000" total="17.950" /> <tenured freebytes="1072855776" totalbytes="1073741824" percent="99" > <soa freebytes="1019168992" totalbytes="1020055040" percent="99" /> <loa freebytes="53686784" totalbytes="53686784" percent="100" /> </tenured> </gc> <tenured freebytes="1072855776" totalbytes="1073741824" percent="99" > <soa freebytes="1019168992" totalbytes="1020055040" percent="99" /> <loa freebytes="53686784" totalbytes="53686784" percent="100" /> </tenured> <refs soft="1" weak="4" phantom="0" dynamicSoftReferenceThreshold="31" maxSoftReferenceThreshold="32" /> <time totalms="18.043" /></sys>JVMDUMP006I 正在处理转储事件“systhrow”,详细信息“java/lang/OutOfMemoryError”- 请稍候。JVMDUMP032I JVM 使用“D:\IBM SOFT\IBM JVM\jca401\Snap.20110126.143508.15788.0001.trc”来请求 Snap 转储以响应事件JVMDUMP010I Snap 转储已写入 D:\IBM SOFT\IBM JVM\jca401\Snap.20110126.143508.15788.0001.trcJVMDUMP032I JVM 使用“d:\temp\heapdump.20110126.143508.15788.0002.phd”来请求 Heap 转储以响应事件JVMDUMP010I Heap 转储已写入 d:\temp\heapdump.20110126.143508.15788.0002.phdJVMDUMP032I JVM 使用“d:\temp\javacore.20110126.143508.15788.0003.txt”来请求 Java 转储以响应事件JVMDUMP010I Java 转储已写入 d:\temp\javacore.20110126.143508.15788.0003.txtJVMDUMP013I 已处理转储事件“systhrow”,详细信息:“java/lang/OutOfMemoryError”。Exception in thread "main" java.lang.OutOfMemoryError: 未能分配 JNIEnv at java.lang.Thread.startImpl(Native Method) at java.lang.Thread.start(Thread.java:887) at org.smart.threadtest.ThreadStackTest.main(ThreadStackTest.java:23)
?
?
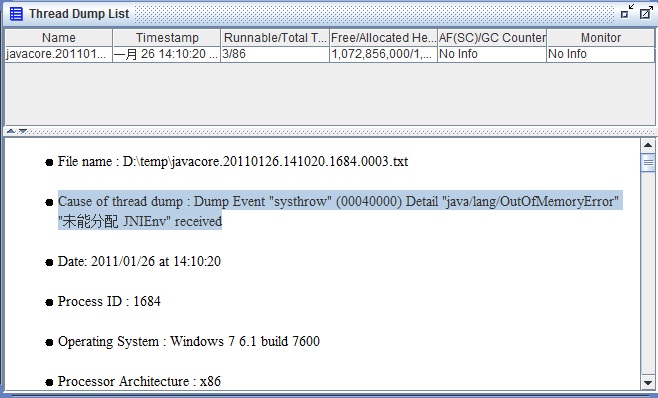
82×10M + 1024M = 1844M,IBM JDK能够产生heapdump和core文件,这点比SUN JDK强,core文件内容如下:
?
?
?
同样将heapsize调整为124M测试,命令如下:
?
D:\Java\ibm_jdk16.0\bin\java -Djava.compiler=NONE -verbose:gc,sizes -Xms124m -Xmx124m -Xss10240K -Xiss10240K -cp D:\maven\smart\smart\target\test-classes\ org.smart.threadtest.ThreadStackTest
?
输出如下:
<?xml version="1.0" ?><verbosegc version="20100308_AA"> -Xmca32K RAM 类分段增量 -Xmco128K ROM 类分段增量 -Xmns0K 初始新空间大小 -Xmnx0K 最大新空间大小 -Xms124M 初始内存大小 -Xmos124M 初始旧空间大小 -Xmox124M 最大旧空间大小 -Xmx124M 最大内存 -Xmr16K 已记住的集合大小 -Xmso256K 操作系统线程堆栈大小 -Xiss10M Java 线程堆栈初始大小 -Xssi16K Java 线程堆栈增量 -Xss10M Java 线程堆栈最大大小<initialized> <attribute name="gcPolicy" value="-Xgcpolicy:optthruput" /> <attribute name="maxHeapSize" value="0x7c00000" /> <attribute name="initialHeapSize" value="0x7c00000" /> <attribute name="compressedRefs" value="false" /> <attribute name="pageSize" value="0x1000" /> <attribute name="requestedPageSize" value="0x1000" /></initialized>Thread 0 start...Thread 1 start...............Thread 169 start...Thread 170 start...<sys id="1" timestamp="Jan 26 14:42:31 2011" intervalms="0.000"> <time exclusiveaccessms="0.079" meanexclusiveaccessms="0.079" threads="0" lastthreadtid="0x0030EC00" /> <refs soft="6" weak="4" phantom="0" dynamicSoftReferenceThreshold="32" maxSoftReferenceThreshold="32" /> <tenured freebytes="128516864" totalbytes="130023424" percent="98" > <soa freebytes="122016000" totalbytes="123522560" percent="98" /> <loa freebytes="6500864" totalbytes="6500864" percent="100" /> </tenured> <gc type="global" id="1" totalid="1" intervalms="0.000"> <classunloading classloaders="0" classes="0" timevmquiescems="0.000" timetakenms="0.061" /> <finalization objectsqueued="2" /> <timesms mark="2.994" sweep="0.623" compact="0.000" total="3.768" /> <tenured freebytes="129057424" totalbytes="130023424" percent="99" > <soa freebytes="122556560" totalbytes="123522560" percent="99" /> <loa freebytes="6500864" totalbytes="6500864" percent="100" /> </tenured> </gc> <tenured freebytes="129057424" totalbytes="130023424" percent="99" > <soa freebytes="122556560" totalbytes="123522560" percent="99" /> <loa freebytes="6500864" totalbytes="6500864" percent="100" /> </tenured> <refs soft="1" weak="4" phantom="0" dynamicSoftReferenceThreshold="31" maxSoftReferenceThreshold="32" /> <time totalms="3.899" /></sys>JVMDUMP006I 正在处理转储事件“systhrow”,详细信息“java/lang/OutOfMemoryError”- 请稍候。JVMDUMP032I JVM 使用“D:\IBM SOFT\IBM JVM\jca401\Snap.20110126.144231.10464.0001.trc”来请求 Snap 转储以响应事件JVMDUMP010I Snap 转储已写入 D:\IBM SOFT\IBM JVM\jca401\Snap.20110126.144231.10464.0001.trcJVMDUMP032I JVM 使用“d:\temp\heapdump.20110126.144231.10464.0002.phd”来请求 Heap 转储以响应事件JVMDUMP010I Heap 转储已写入 d:\temp\heapdump.20110126.144231.10464.0002.phdJVMDUMP032I JVM 使用“d:\temp\javacore.20110126.144231.10464.0003.txt”来请求 Java 转储以响应事件JVMDUMP010I Java 转储已写入 d:\temp\javacore.20110126.144231.10464.0003.txtJVMDUMP013I 已处理转储事件“systhrow”,详细信息:“java/lang/OutOfMemoryError”。Exception in thread "main" java.lang.OutOfMemoryError: 未能分配 JNIEnv at java.lang.Thread.startImpl(Native Method) at java.lang.Thread.start(Thread.java:887) at org.smart.threadtest.ThreadStackTest.main(ThreadStackTest.java:23)</verbosegc>
?
?
170×10M + 124M = 1824M??,与上面内存数量基本一致。
?
IBM JDK表现与SUN的JDK基本一致,都是占用操作系统内存。
??
?