
python-memcached client 性能问题
线上发现memcached偶发超过100ms的情况,刚开始以为是memcached server连接数过多的问题,后台测试发现本地也存在这个问题,应该是memcached-client实现导致大并发下,性能太差:
ab -n1000 -c20 http://127.0.0.1:7299/category/life/
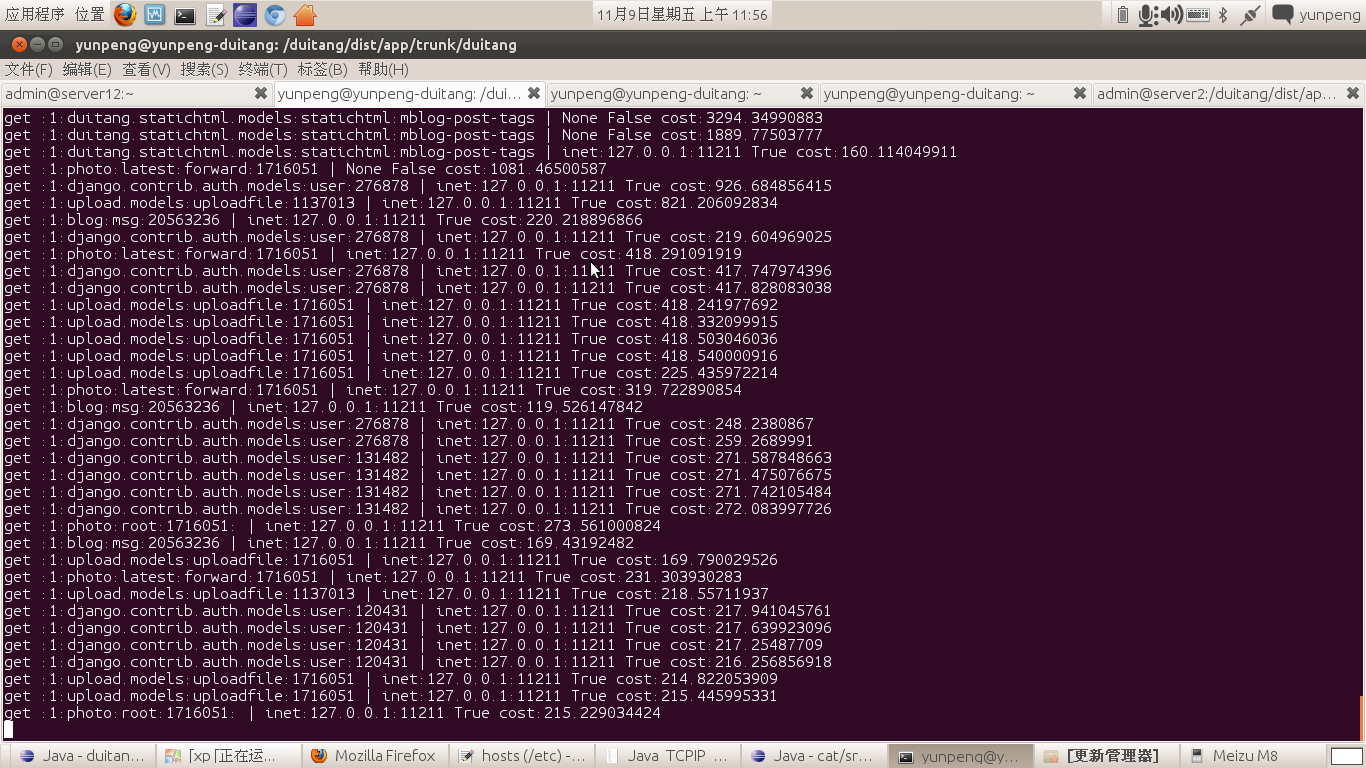
?
测试pylibmc性能很好,同样并发下面很少有耗时超过1毫秒的:
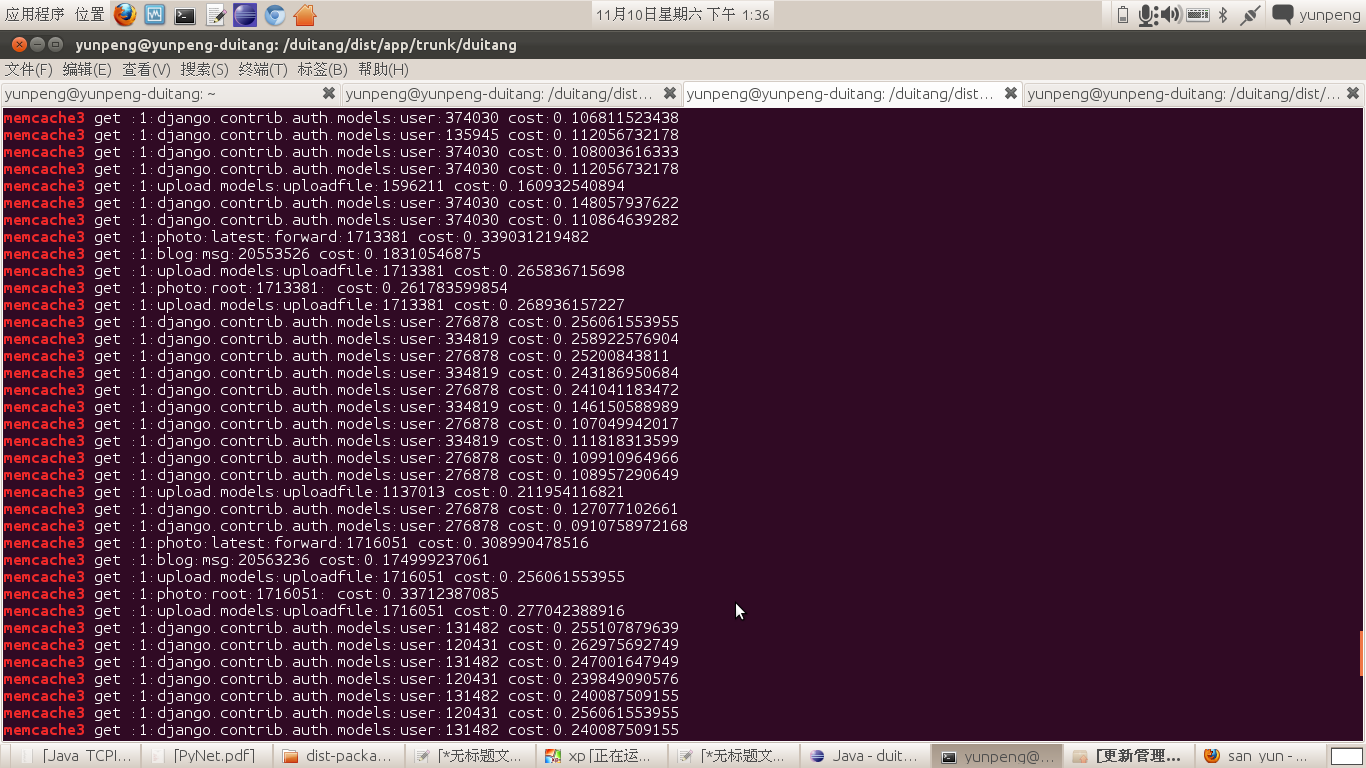
?
pylibmc的连接数也很稳定:
?
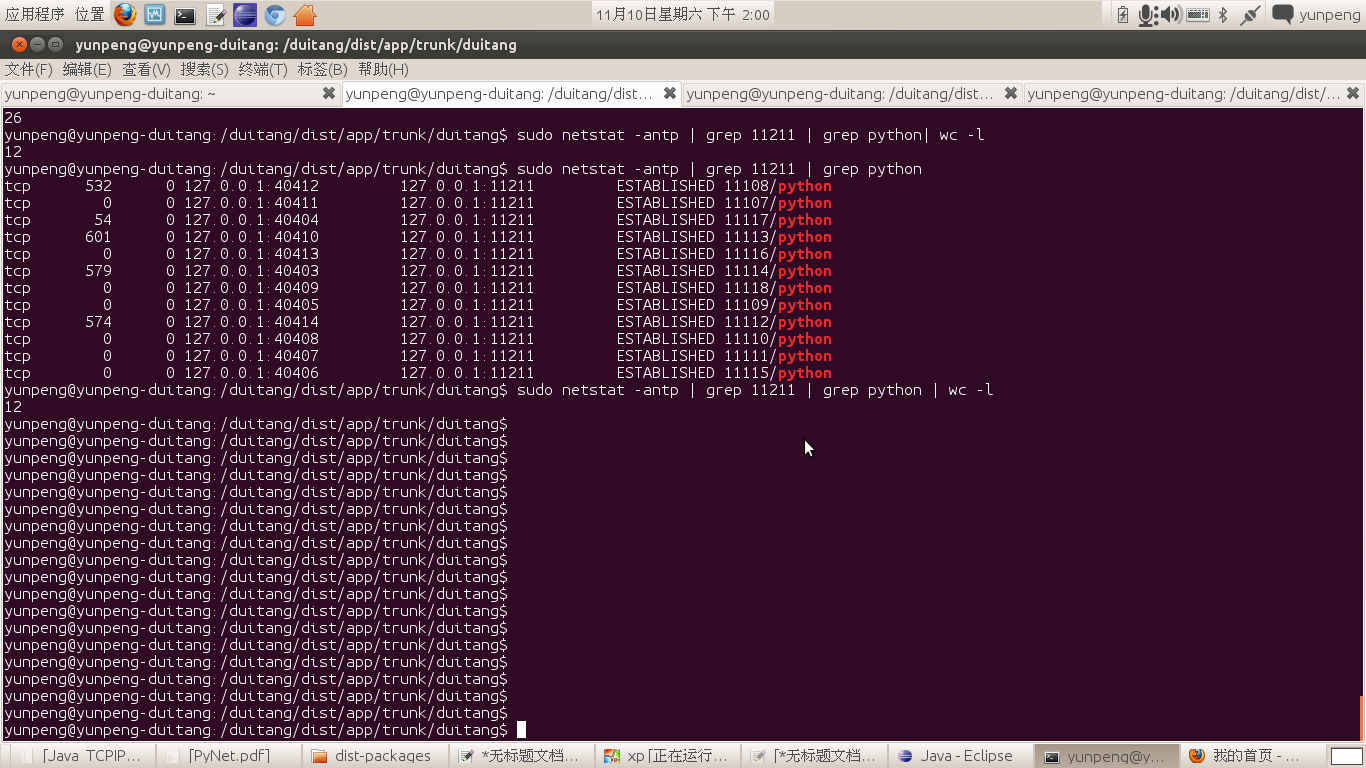
?
# -*- coding: utf-8 -*-import timeimport pylibmcmc = pylibmc.Client(["127.0.0.1"])class Client(): def __init__(self, servers): ''' 忽略掉memcached的server配置,使用cache_server ''' def get(self,key): starttime = time.time() val = mc.get(key) endtime = time.time() exe_time = (endtime - starttime)*1000 if exe_time>100: print "memcache3 get %s cost:%s"%(key,exe_time) return val def set(self, key, val, time=0, min_compress_len=100): return mc.set(key,val,time) def delete(self,key, time=0): return mc.delete(key) def incr(self, key, delta=1): return mc.incr(key,delta)?
?
?
?
?
由于dboss-client是模仿python memcached? client实现的,也很慢,通过打点发现,瓶颈在:
def readline(self): buf = self.buffer recv = self.socket.recv while True: index = buf.find('\r\n') if index >= 0: break data = recv(4096) if not data: self.mark_dead('Connection closed while reading from %s' % repr(self)) self.buffer = '' return '' buf += data self.buffer = buf[index+2:] return buf[:index]?
dboss测试对比了性能,和原来的差别不大:
AB:
memcached:
Percentage of the requests served within a certain time (ms)
? 50%??? 785
? 66%??? 931
? 75%?? 1041
? 80%?? 1102
? 90%?? 1266
? 95%?? 1428
? 98%?? 1595
? 99%?? 1682
?100%?? 1811 (longest request)
dboss:
Percentage of the requests served within a certain time (ms)
? 50%??? 799
? 66%??? 918
? 75%??? 992
? 80%?? 1038
? 90%?? 1228
? 95%?? 1382
? 98%?? 1689
? 99%?? 1998
?100%?? 2432 (longest request)
?
统计get的执行时间(20个并发)
?
dboss:
total: 75243
?0.014%? 10ms? -? 563ms(count:1100)
99.986%? <10ms
?
memcached:
total: 77508
0.014%? 10ms? -? 660ms(count:1100)
99.986%? <10ms
?
redis:
total: 2400
10%? 4.2ms~127ms
90%? <4.2ms
?
最后看看恐怖的pylibmc:
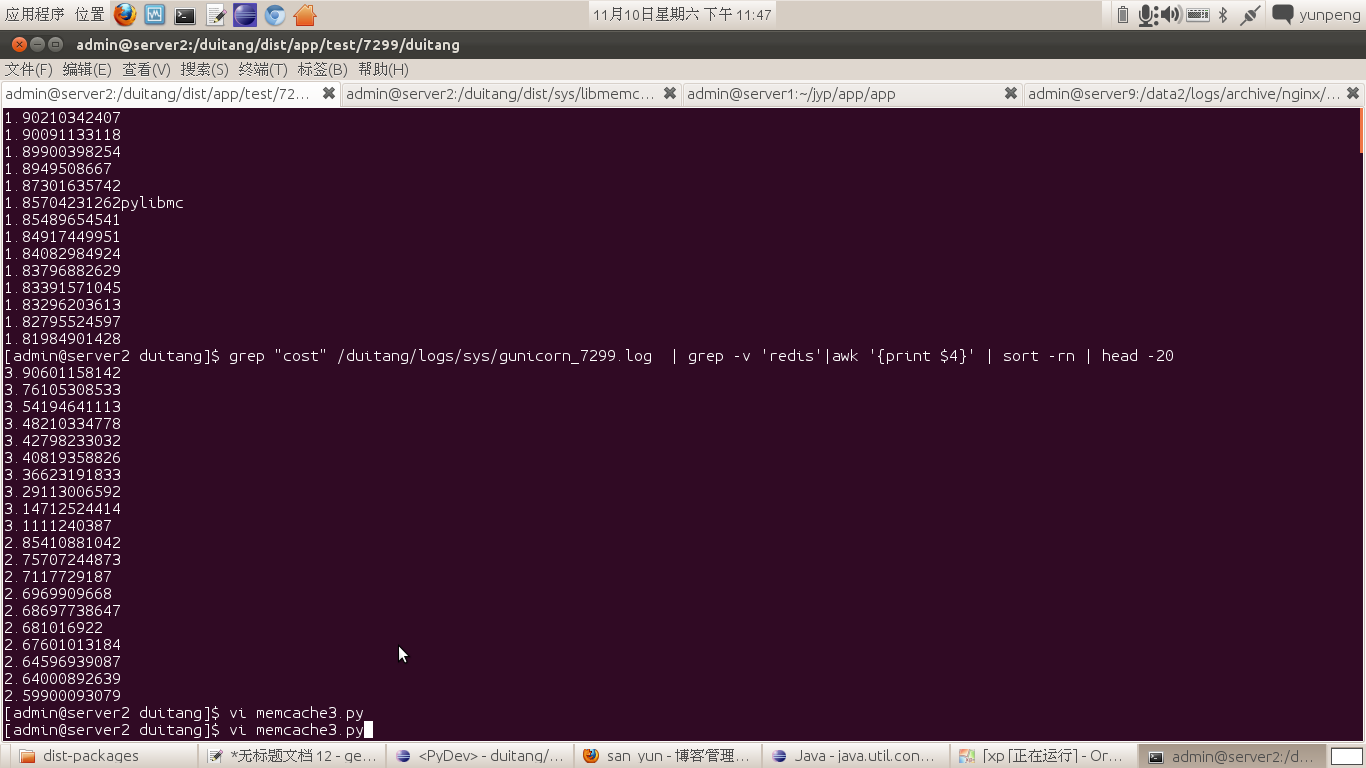
?