统计图表ChartDirector在Servlet和Struts2中的应用1、公共配置a.把ChartDirector.jar放到\webapp\WEB-INF\l
统计图表ChartDirector在Servlet和Struts2中的应用
1、公共配置
a.把ChartDirector.jar放到\webapp\WEB-INF\lib下面,并加入以下包:
<dependency> <groupId>javax.servlet</groupId> <artifactId>servlet-api</artifactId> <version>2.5</version> <type>jar</type> <scope>provided</scope> </dependency>
b.在web.xml加入以下代码:
<servlet><servlet-name>GetSessionImage</servlet-name><servlet-class>ChartDirector.GetSessionImage</servlet-class></servlet><servlet-mapping><servlet-name>GetSessionImage</servlet-name><url-pattern>*.chart</url-pattern></servlet-mapping>
c.把chartdir.lic文件在\src\main\java下面,其内容如下:
SXZVFNRN9MZ9L8LGA0E2B1BB
2、编写Servlet代码
a.web.xml加入以下代码:
<servlet><servlet-name>BarChartServlet</servlet-name><servlet-class>sample.servlet.BarChartServlet</servlet-class></servlet><servlet-mapping><servlet-name>BarChartServlet</servlet-name><url-pattern>/barchart</url-pattern></servlet-mapping>
b.Servlet代码如下:
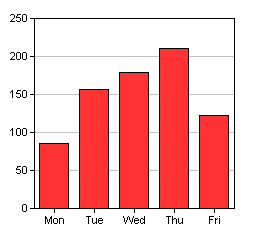
public class BarChartServlet extends HttpServlet {public void doGet(HttpServletRequest request, HttpServletResponse response)throws ServletException, IOException {// The data for the bar chartdouble[] data = { 85, 156, 179.5, 211, 123 };// The labels for the bar chartString[] labels = { "Mon", "Tue", "Wed", "Thu", "Fri" };// Create a XYChart object of size 250 x 250 pixelsXYChart c = new XYChart(250, 250);// Set the plotarea at (30, 30) and of size 200 x 190 pixelsc.setPlotArea(30, 30, 200, 190);// Add a bar chart layer using the given datac.addBarLayer(data);// Set the x axis labels using the given labelsc.xAxis().setLabels(labels);request.getSession().setAttribute("chart1", c.makeChart2(Chart.PNG));String chart1URL = "img=chart1&id=" + System.currentTimeMillis();// include tool tip for the chartString imageMap1 = c.getHTMLImageMap("#", "","title='{xLabel}: US${value}K'");response.setContentType("text/html");ServletOutputStream out = response.getOutputStream();out.println("<html>");out.println("<body>");out.print("<img src="getchart.chart?");out.print(chart1URL);out.println("" usemap="#map1" border="0">");out.println("<map name="map1">");out.println(imageMap1);out.println("</map>");out.println("</body>");out.println("</html>");}}3、编写Action代码
a.Action代码如下:
public class ChartAction extends BaseAction {Logger logger = Logger.getLogger(ChartAction.class);@Action(value = "/barchart", results = { @Result(name = "success", location = "/index.jsp") })public String barchart() {// The data for the bar chartdouble[] data = { 85, 156, 179.5, 211, 123 };// The labels for the bar chartString[] labels = { "Mon", "Tue", "Wed", "Thu", "Fri" };// Create a XYChart object of size 250 x 250 pixelsXYChart c = new XYChart(250, 250);// Set the plotarea at (30, 30) and of size 200 x 190 pixelsc.setPlotArea(30, 30, 200, 190);// Add a bar chart layer using the given datac.addBarLayer(data);// Set the x axis labels using the given labelsc.xAxis().setLabels(labels);getRequest().getSession().setAttribute("chart1",c.makeChart2(Chart.PNG));String chart1URL = "img=chart1&id=" + System.currentTimeMillis();// include tool tip for the chartString imageMap1 = c.getHTMLImageMap("#", "","title='{xLabel}: US${value}K'");getRequest().setAttribute("chart1URL", chart1URL);getRequest().setAttribute("imageMap1", imageMap1);return SUCCESS;}}b.index.jsp页面代码如下:
<div><img border="0" usemap="#map1" src="getchart.chart?${chart1URL}"><map name="map1">${imageMap1}</map></div>4、配置说明
关于图片的显示方法可以根据自己的需求。我在Servlet和Action中采用了两种方法。另外提醒一下,如果改用jsp时,记得把getchat.jsp放到webapp下面。
5、显示结果如下: